aijelen.hu / Articles / Analysis
How Model Updates Break Your Visibility Trend Lines
Model version changes invalidate historical data, requiring segmented trend analysis and distribution-based sampling to detect real shifts in AI visibility.
Model Versions as Hidden Variables
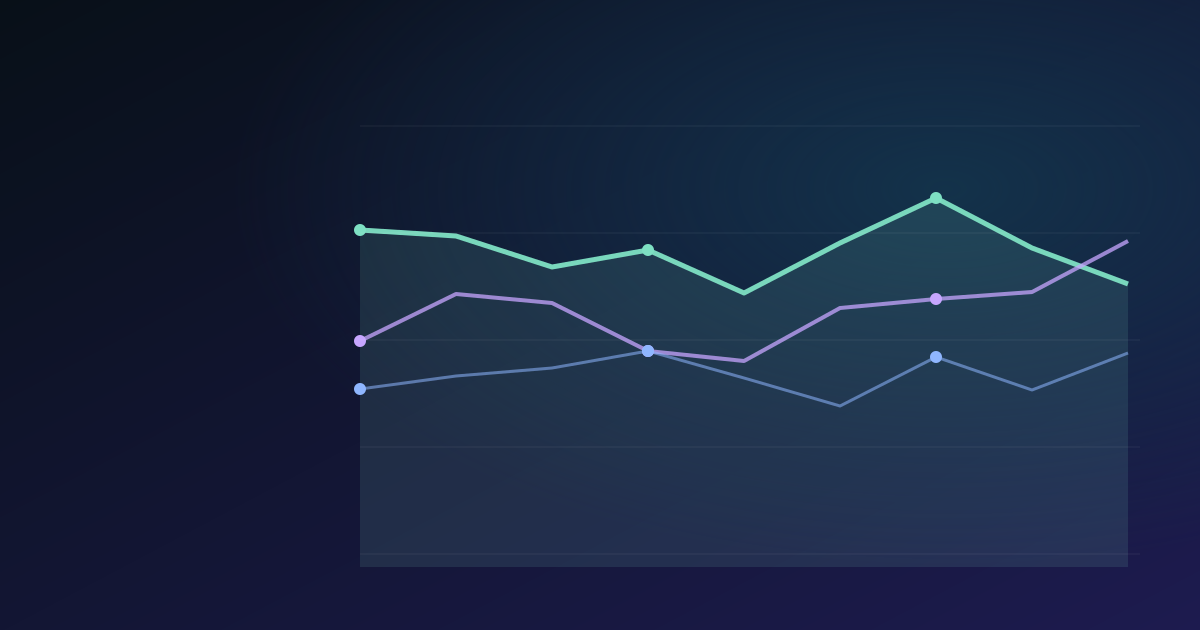
Every AI response carries an invisible timestamp tied to the specific model checkpoint running at that moment. When a provider updates the underlying weights, the system shifts from one statistical distribution to another without notifying the user. This creates a hidden variable in your data stream that looks like noise but is actually a structural break in the measurement logic.
Your brand might appear in 60% of responses under Version A and drop to 40% under Version B. This drop does not necessarily mean your content quality declined. It indicates the model's internal representation of your entity changed, or the retrieval mechanism prioritized different sources. Treating these two percentages as a continuous line leads to false conclusions about your performance.
Standard analytics tools assume continuity. They draw a straight line between last week's score and this week's score. AI systems do not operate this way. They operate on discrete updates where the rules of engagement change overnight. You must identify the update event and treat the data before and after as separate populations for statistical comparison.
Ignoring this variable turns your audit into a guessing game. You cannot distinguish between a genuine loss of relevance and a simple algorithmic shift. The only way to resolve this ambiguity is to tag every measurement with the specific model version or update cycle it belongs to. This metadata becomes the primary key for your longitudinal analysis.
Temporal Obsolescence Thresholds
Data collected six months ago may no longer be comparable to today's results due to the natural drift of parametric memory. Models trained on static datasets eventually become defunct dinosaurs as the world changes around them. This phenomenon, known as model drift, means that a baseline established in January might be statistically invalid by June.
The threshold for obsolescence varies by platform and update frequency. Some systems undergo continuous fine-tuning that alters behavioral patterns weekly, while others rely on full retraining cycles that occur annually. You must determine the specific cadence for each AI engine you monitor. A trend line spanning two major retraining events contains no meaningful signal.
When a model updates, the definition of 'authority' or 'relevance' can shift instantly. A source that was highly ranked yesterday might be deprioritized today due to a change in the training data distribution. This creates a temporal obsolescence zone where historical benchmarks lose their predictive power. You must discard or flag data points that fall outside the current model's operational window.
Establishing a hard cutoff date for your baselines prevents false alarms. If a model update occurs, reset your trend line. Compare the new data only against the new baseline. This approach isolates the impact of the update from the impact of your actual optimization efforts. It ensures you are measuring progress, not just reacting to system noise.
Segmenting Trend Lines
Do not plot a single line representing your total visibility across all time. Instead, segment your chart by model version or update cycle. Each segment represents a distinct experimental condition where the rules of the game remained constant. This segmentation reveals the true trajectory of your brand within each specific environment.
Within each segment, apply distribution-based statistics rather than point estimates. Run a minimum of thirty queries to capture the variance inherent in the system. Calculate the interquartile range and the coefficient of variation. These metrics tell you if your visibility is stable or volatile, regardless of the absolute percentage.
Compare the segments side by side to assess the magnitude of the shift. Did the median mention rate drop by ten points after the update? Or did the entire distribution shift downward? This granular view helps you diagnose whether the issue is a systemic devaluation of your entity or a temporary fluctuation in retrieval logic.
Segmentation also allows you to isolate the effect of your own interventions. If you improved your structured data in March, but the model updated in April, you can see if the improvement survived the transition. Without segmentation, the update would wash out your gains, making your work appear ineffective. Clear boundaries between versions protect your strategic insights.
Fine-Tuning Cycles and Update Frequency
Instruction fine-tuning and RLHF cycles update more frequently than full parametric retraining. These updates adjust the model's tone, refusal thresholds, and helpfulness calibration without necessarily refreshing the core world knowledge. However, they can still alter how your brand is presented in the final output.
A model might retain the fact that your company exists in its base weights but change how it describes your services due to a new safety filter or style guide. This creates a subtle form of drift where the entity is present but the sentiment or context shifts. You must monitor not just the mention rate but the quality of the mention.
Continuous integration pipelines mean that updates can happen daily or even hourly. Some platforms use A/B testing on live traffic, routing different users to different checkpoints. This introduces a second layer of variability where the 'current' model is actually a moving target. Your sampling strategy must account for this fluidity.
Document the update schedule for every platform you track. Note when major version numbers change and when minor patches are deployed. Correlate these dates with spikes or drops in your visibility data. This correlation helps you distinguish between external system changes and internal content issues. It transforms random noise into actionable intelligence.
Reporting Across Versions
Your reports must explicitly state the model version used for each data point. Never present a trend line that spans multiple major updates without annotation. Use visual markers to indicate where the system architecture changed. This transparency builds trust with stakeholders who need to understand the context of the numbers.
Separate visibility signals from trust signals and business outcome signals. A drop in visibility might be due to a model update, while a drop in business outcomes could be due to market factors. Keeping these distinct prevents you from misattributing the cause of a decline. It allows you to focus on the levers you can actually control.
Include a section in every report that analyzes the impact of recent updates. Explain how the new model version behaves differently regarding your entity. Did it start citing new sources? Did it stop mentioning your brand in specific contexts? This narrative adds depth to the raw data and guides future strategy.
Update your baseline definitions regularly to reflect the current state of the AI ecosystem. A baseline from a year ago is likely obsolete. Refresh your reference datasets quarterly or whenever a significant model update occurs. This ensures your performance metrics remain relevant and your optimization efforts are directed at the right targets.
Key takeaways
- Treat every major model update as a structural break that invalidates previous trend lines.
- Use distribution-based sampling with at least thirty queries to account for inherent system variance.
- Segment your data by model version to isolate the impact of algorithmic changes from content improvements.
- Monitor both mention rates and mention quality to detect subtle shifts in fine-tuning cycles.
- Explicitly annotate all reports with model versions to prevent misinterpretation of visibility trends.
Related questions
How often should I reset my visibility baseline?
Reset your baseline whenever a major model version update occurs or when you observe a structural break in your data distribution. For platforms with frequent continuous updates, a quarterly review is recommended to ensure your reference points remain relevant to the current system architecture.
Why is a single measurement not enough for AI visibility?
A single measurement captures only one snapshot of a highly variable system influenced by server routing, context windows, and stochastic sampling. You need a distribution of at least thirty measurements to calculate a reliable mean and variance, distinguishing true visibility from random noise.
Can I compare visibility scores across different AI platforms?
Direct comparison is risky because each platform uses different retrieval mechanisms and model architectures. You should analyze trends within each platform separately and only compare relative performance changes, not absolute scores, unless you have normalized the data across specific technical constraints.
AI-assisted: drafted with a language model from the author's research notes, then edited and checked before publication. Author: Zoltán Varga, AI visibility researcher and AI ecosystem architect, Budapest.